Analytics
Insight into every aspect of your network, with predictive and preemptive solutions activated before a problem is even a problem
NDS provides partners and their clients robust reporting capabilities to analyze network performance and capacity.
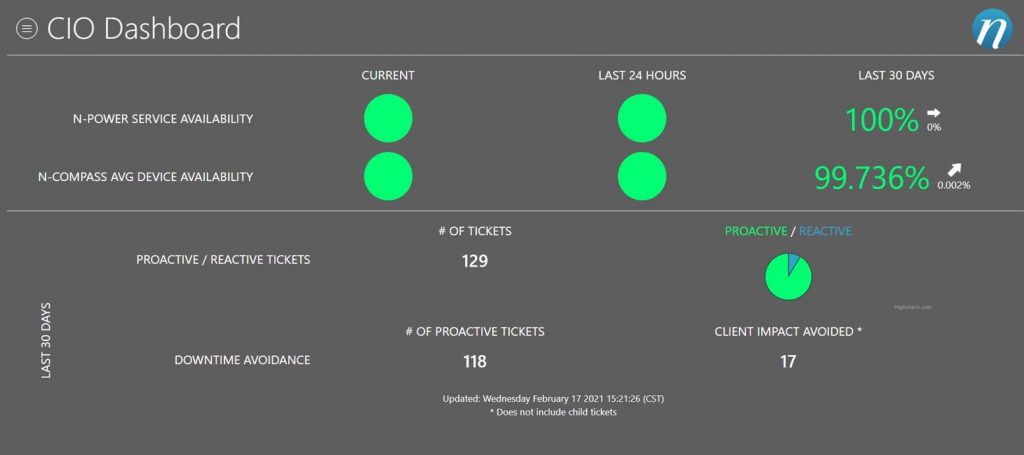
The CIO Dashboard is a real-time snap shot status of your voice and data infrastructure and includes the last 24 hours, last 30 days, and the trends.

The dashboard provides insight regarding the total number of tickets, the number of proactive tickets, their percentage to the total, and the number of avoided impacts.
Our client review meetings, in partnership with our reporting, provide valuable insight to evaluate strategic IT plans and budgets.
Our value-added reporting allows clients to view, manipulate and quickly see trends by:
- Location, device type and quantity
- Location, device type, close codes and quantity
- Location, device type, issue types, and quantity
- Average tickets by close code; displayed by location, device type, close codes
- Average tickets by Issue type; displayed by location, device type, issue type
- Most chronic devices by close codes
- Comparative data on average ticket by device category (router, switch, firewall) comparing to other clients. No client names shared.
Contact Us
If you’re ready to learn more about how Network Data Systems can take your network to the Nth power, let’s talk.
(847) 385-6700


